Working with a colour chart is a system to control the printed outcome of a design. You can select a colour from a printed chart, then using the RGB colour values apply them into a digital file. This process takes into account the way a colour will print onto a textile and not just the colour as it appears on screen.
This method of colour management is designed to mitigate the different representations of colour on devices. For example a sky blue with the same colour values will present differently on a phone, computer screen and a tablet. Things like screen luminosity, contrast and the conditions you are working in will all impact colour.
Each Next State textile has been calibrated to produce the best colour, contrast, detail and final print outcome for artwork. Individual colours can take on a different appearance depending on the textile they are printed on. Some textiles can have a strong white point and others an oatmeal background, some are glossy and some matte. We recommend the Colour Chart you print is on the desired end use fabric.
Printing a Next State Colour Chart on the fabric of your choice will give you a colour map you can work off to predict final printed colours.
Step 1
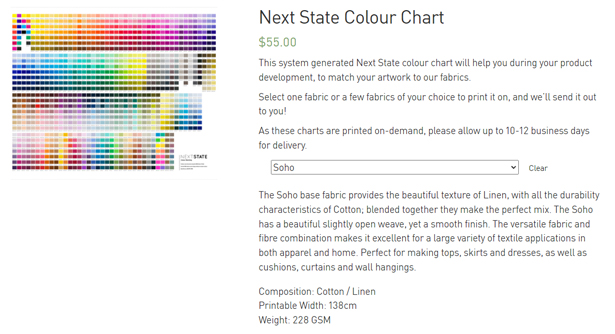
Select the fabric you wish to have the colour chart printed onto.
Step 2
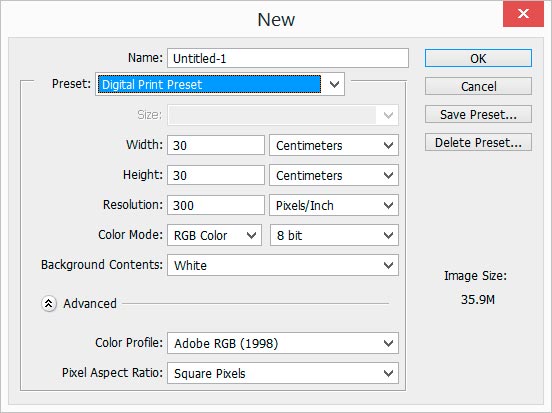
Create a new document using the Next State recommended file Set-up
Try to create a file at the desired end scale. If you are designing a repeating tile and want it as a 30cm square work at that scale.
- RGB
- 300ppi
Step 3
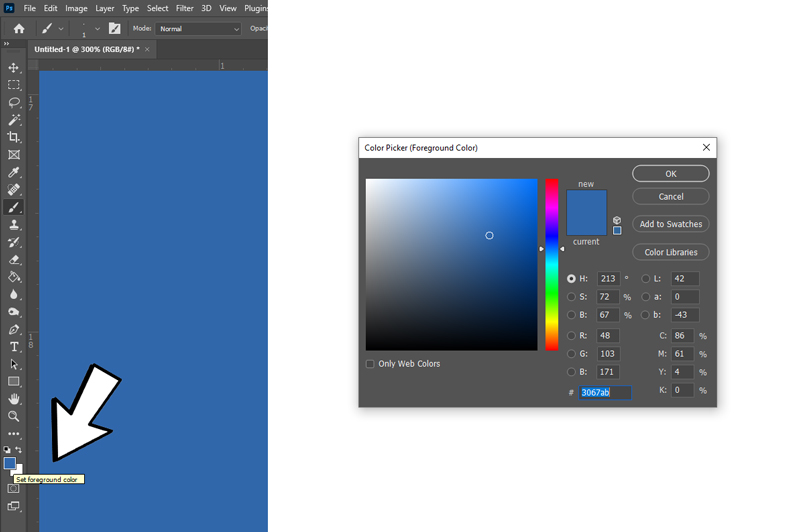
In Illustrator or Photoshop you can use different colour tools to access colour values. If you double click on any of the colours in the swatch tool bar you are able to input colour values via the colour picker.
Using the RGB values on the colour chart from a selected colour, type them into the RGB space in the Colour Picker.
You will see all the different options of colour modes (CMYK,LAB,#) update when you enter values, they are all different ways of articulating colour.
Step 4
By selecting the desired colour from the printed chart, even if it looks slightly different on screen, you will have more control over the way that colour prints.
